The third quarter of 2026 presented investors with a complex set of conditions. Interest rates climbed to 20-year highs, yet strong corporate earnings continued to underpin equity markets. Oil prices surged back above $100 per barrel, the Federal Reserve raised rates for the first time in three years, and attention is turning to November’s midterm elections as concerns around AI continue to evolve.
Despite this backdrop, major U.S. stock indices ended the quarter near all-time highs, and gains were not confined to a single market segment. The energy sector, international equities, and commodities all contributed to portfolio performance. While rising rates have weighed on bonds, yields now sit at their most attractive levels in recent memory. Maintaining portfolio balance remains the cornerstone of navigating these shifting conditions as the fourth quarter begins.
Key market and economic drivers in Q3 20261
• The S&P 500 returned 2.3% in the third quarter with dividends and the Nasdaq Composite gained 2.6%, while the Dow Jones Industrial Average declined -2.3%. Year-to-date, the three indices have returned 12.7%, 16.1%, and 7.2%, respectively.
• Developed market international stocks (MSCI EAFE) gained 0.9%, while emerging market stocks (MSCI EM) declined -0.4% over the quarter, both in U.S. dollar terms.
• The Bloomberg U.S. Aggregate Bond Index fell -3.5% in the third quarter for a year-to-date decline of -2.9%, with longer-dated bonds struggling. The 10-year Treasury yield climbed to 5.29%, a two-decade high.
• The Bloomberg Commodity Index jumped 15.1% over the quarter. Brent crude ended the quarter at $103 per barrel while WTI finished at $90.
• Gold fell further to $4,156 per ounce, while the U.S. Dollar Index recovered to 101.45.
• August headline Consumer Price Index (CPI) rose 3.4% year-over-year, while core CPI, which excludes volatile food and energy prices, increased only 2.4%. The core Personal Consumption Expenditures (PCE) price index, the Fed’s preferred measure of underlying inflation, rose 3.0% year-over-year in August.
• The Federal Reserve raised its key policy rate to a range of 3.75% to 4.00% in September.
• The third estimate of second quarter Gross Domestic Product (GDP) showed that growth was better than expected at 2.2% quarter-over-quarter. This was primarily driven by a 2.5% gain in personal consumption expenditures.
Investors are adjusting to a higher interest rate environment
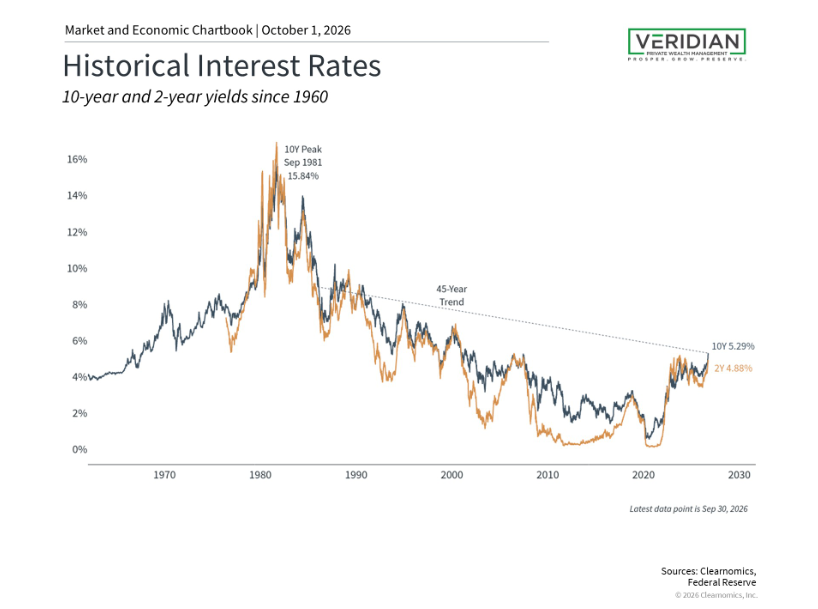
The defining feature of Q3 2026 was the persistent rise in interest rates to levels not seen since the early 2000s. The era of historically low rates that followed the 2008 global financial crisis is no longer the dominant force shaping portfolio decisions. From the peak in the early 1980s through 2020, interest rates declined gradually over roughly four decades, a period widely regarded as a 40-year bull market in bonds.2 That environment has now shifted meaningfully.
Higher rates are also affecting other areas of the economy. According to Freddie Mac, the average 30-year fixed-rate mortgage has risen back above 7% after falling toward 6% earlier in the year.3 This contributes to what economists call the “lock-in” effect, where homeowners with low existing rates are reluctant to sell, dampening housing market activity. For long-term investors, the key takeaway is that attractive bond yields now represent a genuine opportunity within a balanced portfolio.
Earnings growth and AI investments are supporting many asset classes
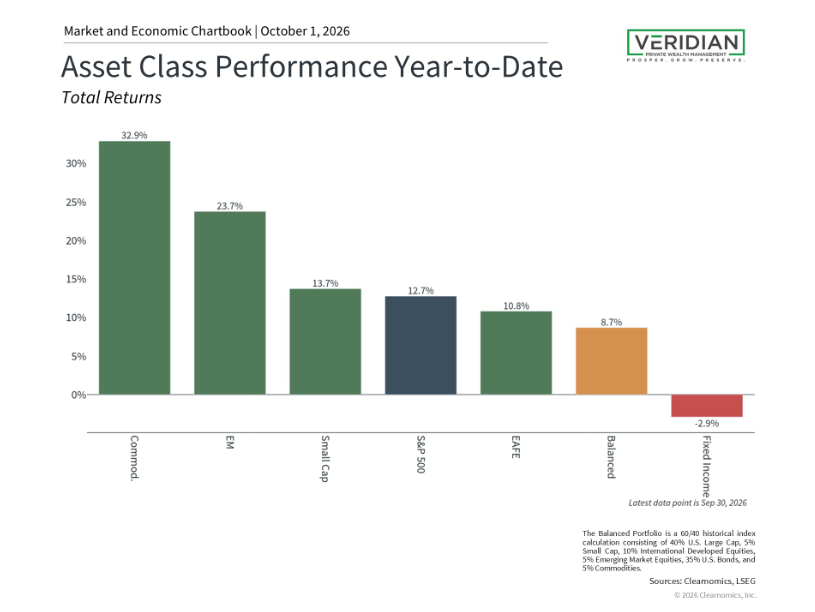
The S&P 500, Nasdaq, and Dow Jones Industrial Average all reached new all-time highs at points during the third quarter. Strong economic conditions and AI infrastructure investment have supported corporate profitability, with current consensus estimates pointing to S&P 500 earnings growth of over 30% for the next twelve months.4 This positive performance has extended beyond U.S. large cap equities, with small cap stocks and international markets, particularly semiconductor companies in Asia, also benefiting from AI-related trends.5
Commodities have added further diversification benefits. Ongoing conflict in the Middle East pushed oil prices from around $70 per barrel in early July to over $100 in September. Copper reached a new all-time high on the back of mine supply deficits and AI infrastructure demand, while diesel hit a record due to constrained global refining capacity. The breadth of contributors across asset classes underscores the value of thoughtful asset allocation heading into Q4.
The Fed raised rates for the first time in three years
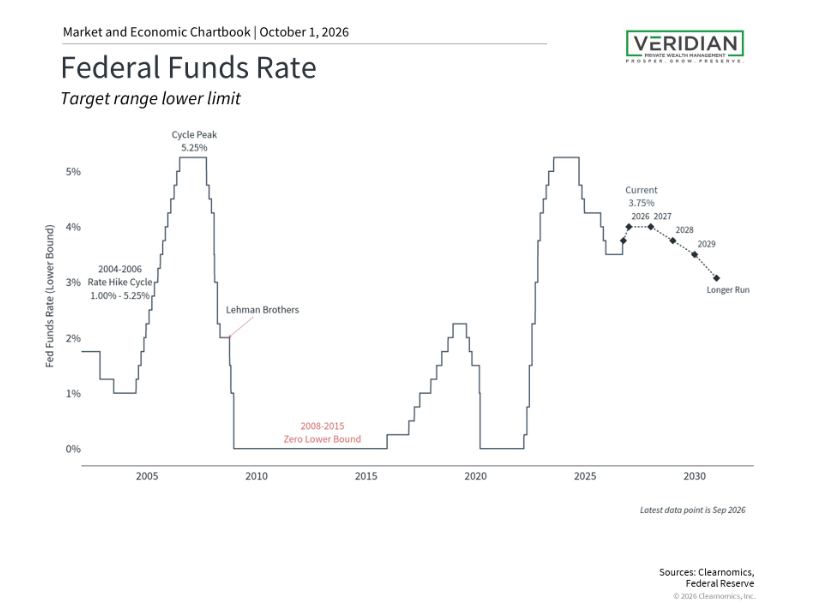
At its September meeting, the Fed raised its policy rate by one-quarter of a percent to a range of 3.75% to 4.00%, the first hike in three years following a period of cuts from September 2024 through December 2025. Markets had priced in the move with over 90% probability ahead of the announcement, and while there was some short-term volatility, equities absorbed the news without significant disruption.6 The hike is largely a response to higher energy prices, a dynamic economists describe as “cost-push inflation.”
Current projections from Fed officials suggest one additional hike may follow before a pause through 2027, with only a gradual easing thereafter. Historically, rising rates and rising markets are not mutually exclusive, particularly later in a business cycle when growth and corporate earnings remain solid. The third quarter demonstrated this clearly, with major indices posting gains even as rates climbed. These projections remain subject to change as economic data evolves.
Upcoming midterm elections and policy uncertainty
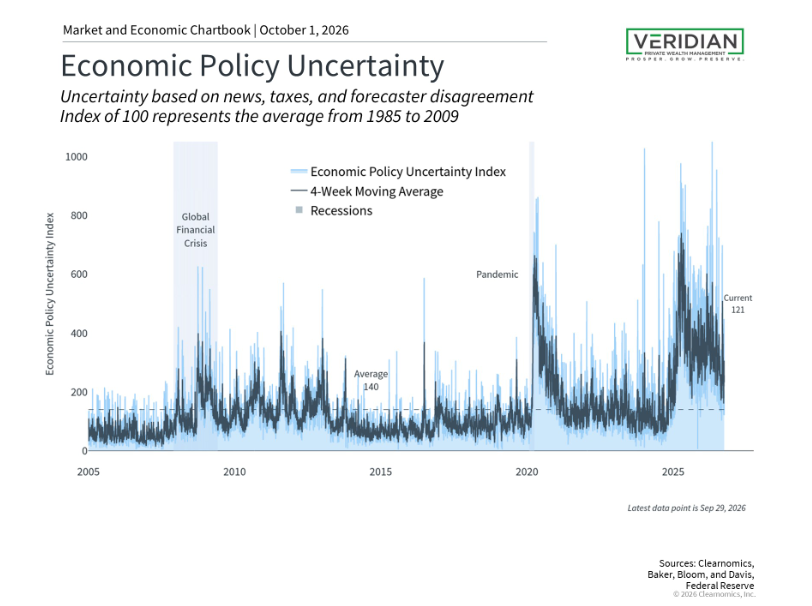
November’s midterm election is unfolding against a backdrop of tariffs, geopolitical tension, inflation, and AI-related policy questions. While economic policy uncertainty has contributed to short-term market volatility over the past two years, markets have also demonstrated resilience and the ability to rebound in ways that can surprise investors. History shows that the S&P 500 has averaged annual total returns of 8.6% in midterm election years since 1933, and that markets have generally performed well across varying compositions of Congress.7,8
Beyond the election itself, fiscal concerns are drawing attention. The total federal debt has recently exceeded $40 trillion for the first time, equivalent to nearly $120,000 per American, and the annual budget deficit is projected to exceed $2 trillion for the government’s 2026 fiscal year.9,10 Over time, these trends could raise government borrowing costs. Even so, the most effective response for investors is to hold a portfolio designed to perform across a range of economic and political conditions, rather than attempting to forecast any single political outcome.
AI, productivity, and stock market sectors
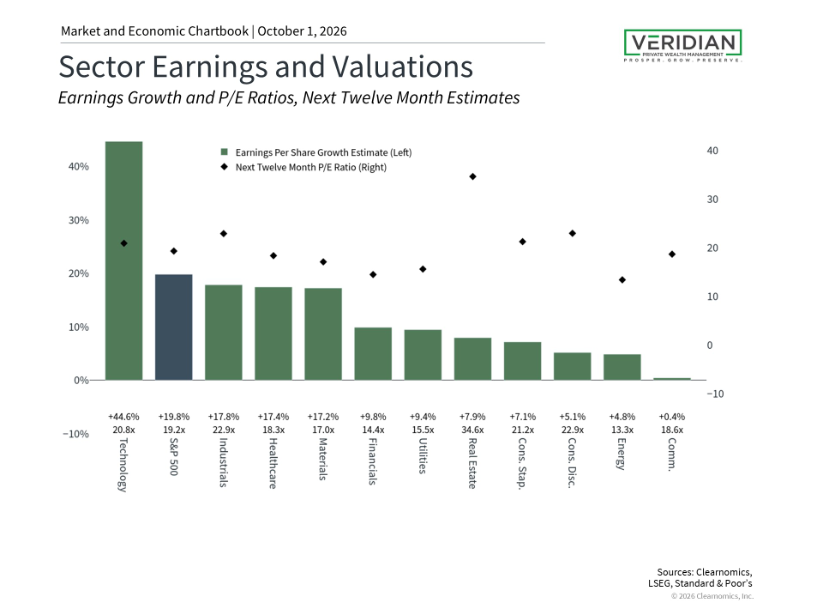
AI and technology trends have been central to market performance over the past decade, driving returns for groups such as the Magnificent 7 and supporting earnings growth across sectors. The chart above illustrates the gap in earnings growth between Information Technology and the other ten S&P 500 sectors.11 While concentration in a handful of names is a valid consideration, other sectors have also delivered healthy returns. The energy sector, buoyed by higher oil prices, is the best performing sector with a 37.4% year-to-date gain through the third quarter.
A central question for AI’s long-term market impact is whether it will translate into broad productivity gains. The 2020s have so far seen average productivity growth of 2.1% per year, up from only 1.2% in the 2010s, which is an encouraging sign. Whether this trend continues will likely shape market and economic outcomes in the years ahead. For now, maintaining a long-term perspective and a balanced portfolio remains the most prudent approach as investors enter the final quarter of 2026.
The bottom line? Stocks reached new highs in the third quarter, with many asset classes contributing to portfolios. As new developments unfold and the midterm election approaches, investors should continue to stay diversified and focus on financial goals.

Angela Major Hart, J.D., CFP®
Angela Major Hart, J.D., CFP® has extensive work experience in the financial and legal sectors and has an unparalleled passion for delivering top-tier client service, portfolio management, and wealth planning.

224-760-4416
Contact